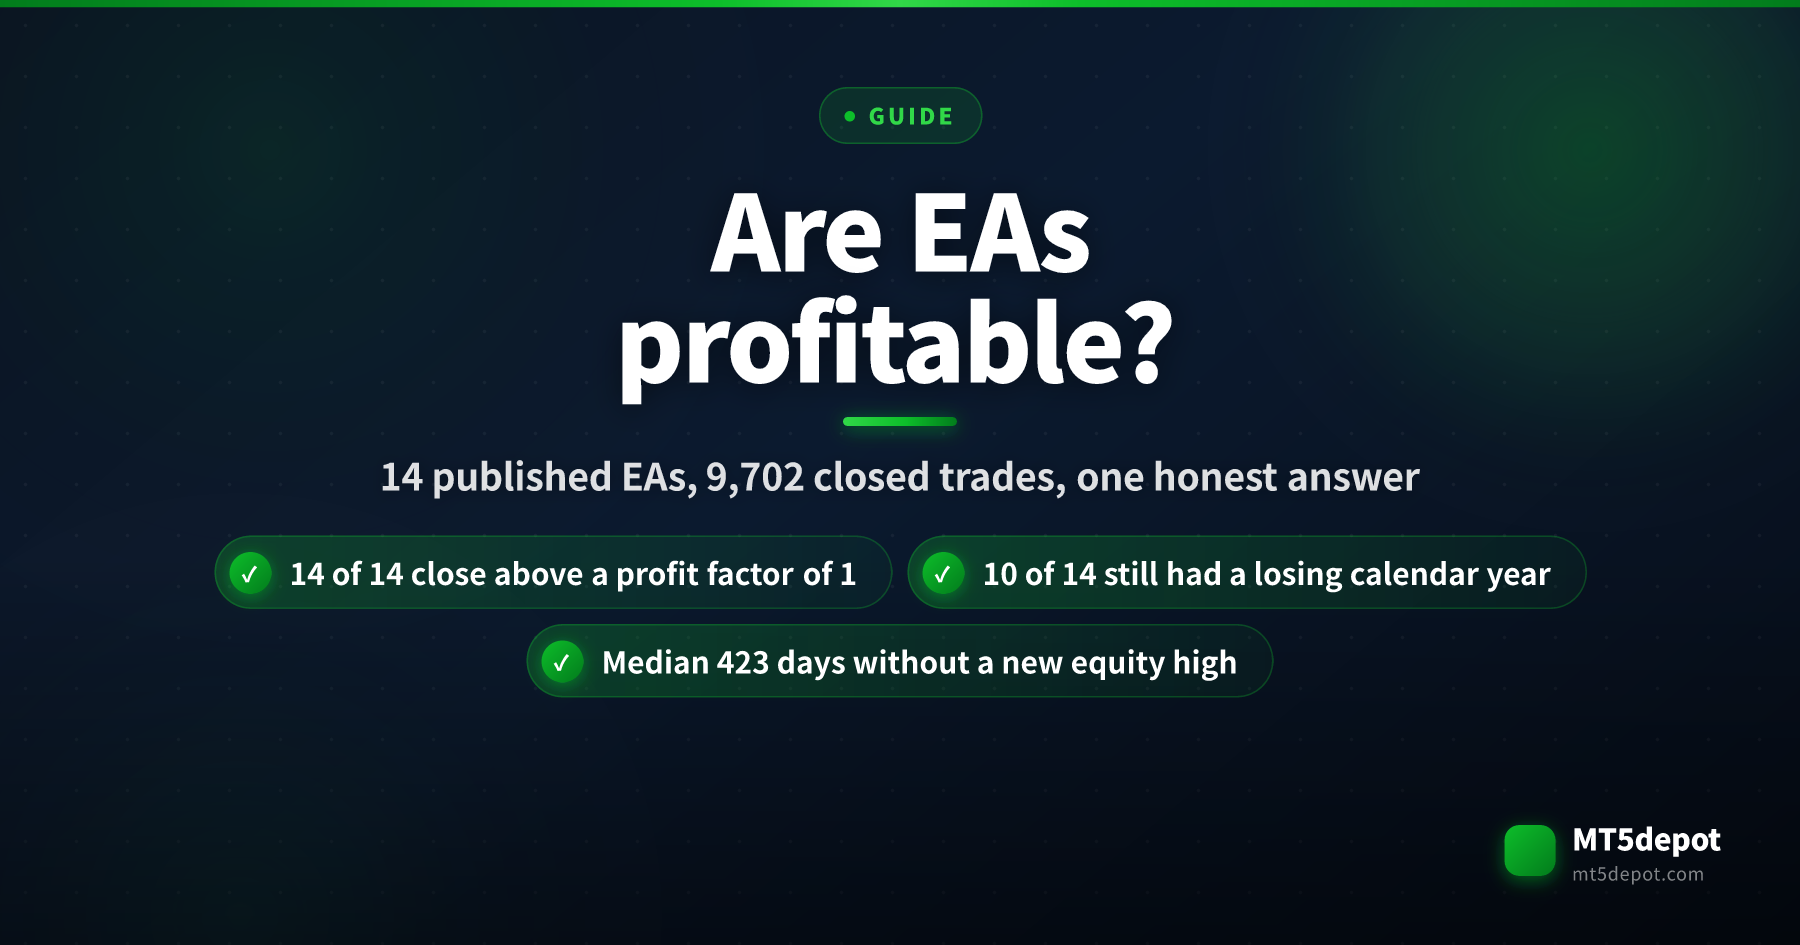
Some are. Every expert advisor published on this site closes its backtest with more gross profit than gross loss, and the full closed-trade record is on the page of each one. But “profitable” turns out to be a claim about a window, not about a program: ten of the fourteen made money over their whole test period and still lost money in at least one calendar year inside it.
But it depends on:
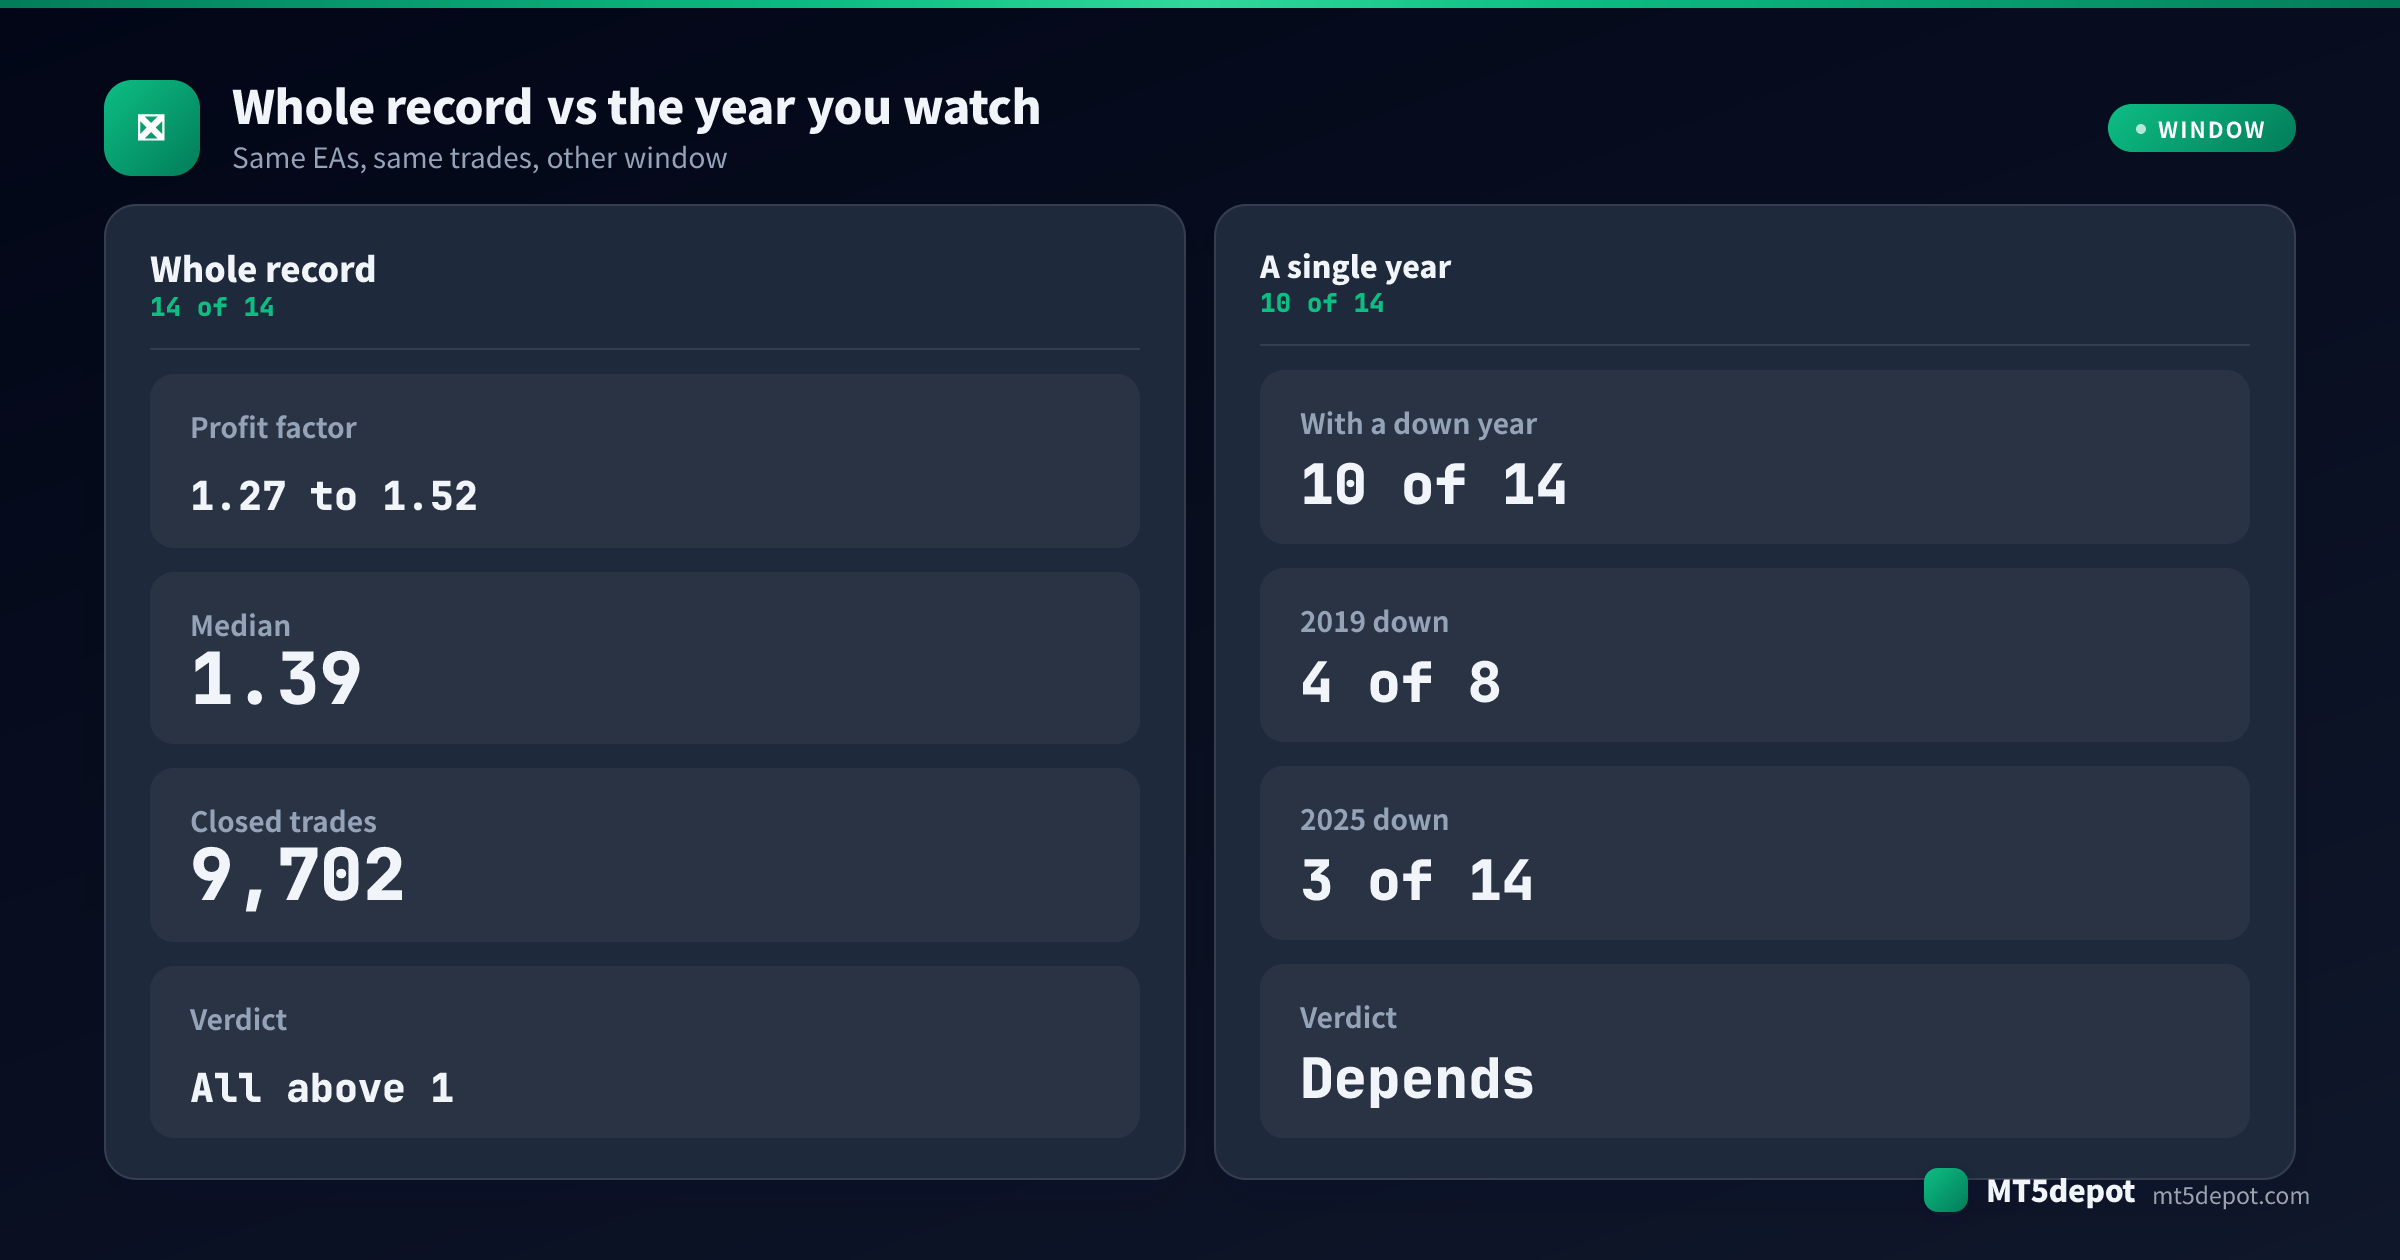
- The window you measure. Ten of fourteen had a losing calendar year; in 2025 three of them finished the year down.
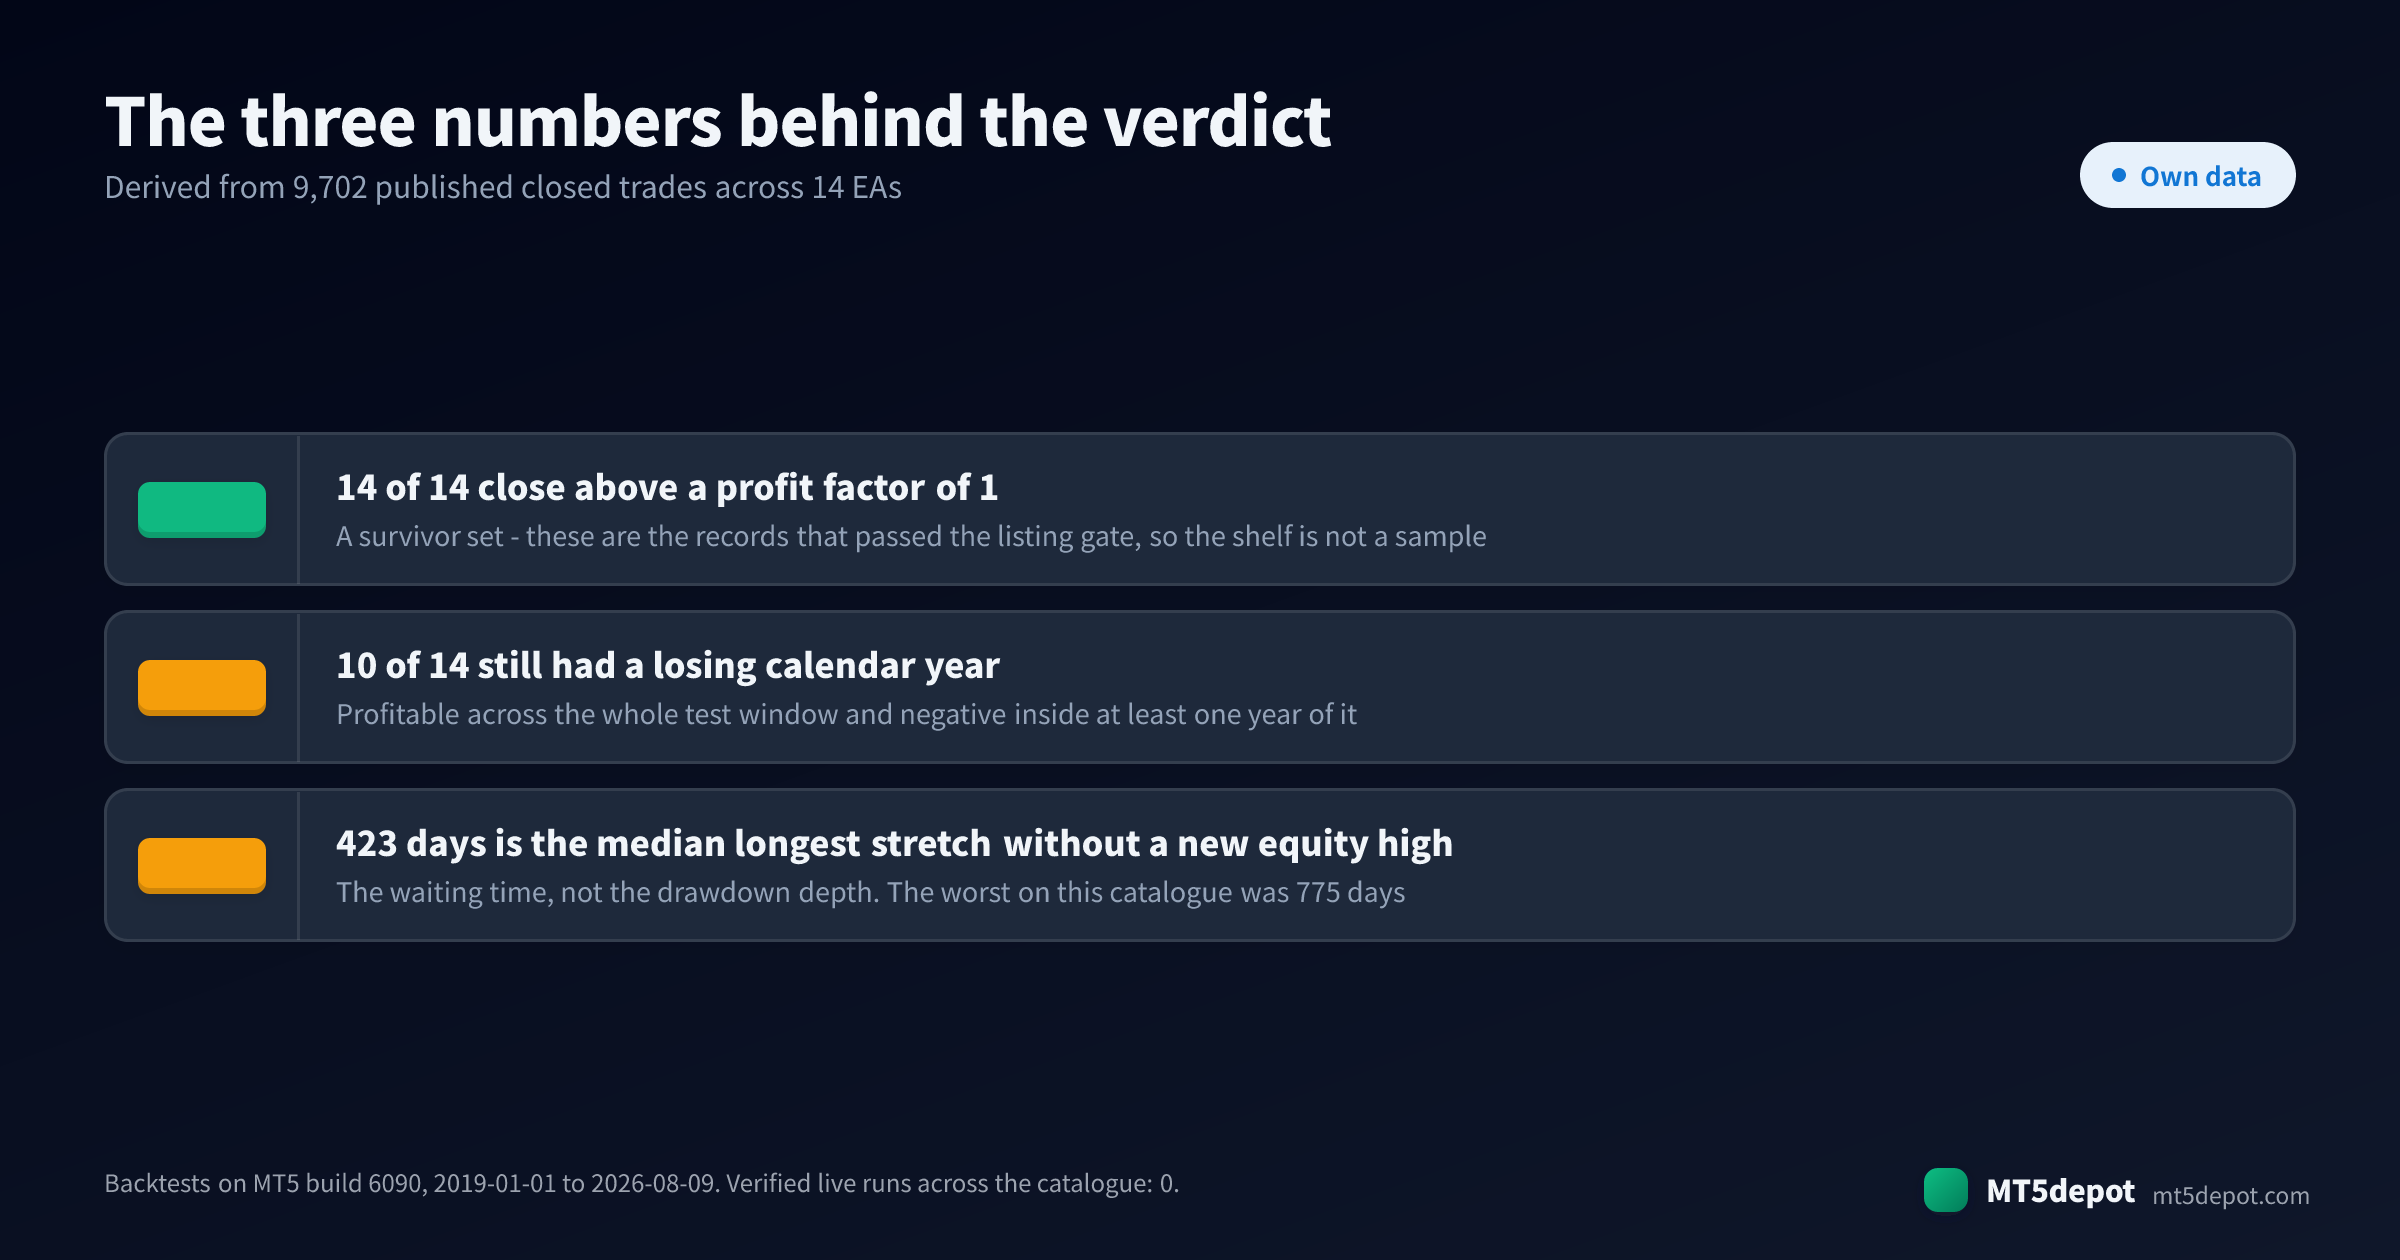
- How long you can wait. Median longest stretch without a new equity high: 423 days. Worst: 775 days.
- How many losses in a row you can take. Median worst losing streak: 6 trades. Worst: 14.
- What “verified” means. Every number here is a backtest. The verified live run count across the catalogue is zero.
- Which EA. The spread between the best and worst profit factor is narrow (1.27 to 1.52), but the net result over the same account size ranges from $386.05 to $28,687.43.
Each of those is tested against our own data below.
What the data shows: 9,702 closed trades across the catalogue
Every EA on mt5depot publishes its complete closed-trade list in its page frontmatter. The table below is derived from those lists — not from a summary someone typed — plus the run manifest that records how each test was produced.
| EA | Symbol / TF | Trades | Profit factor | Win rate | Max drawdown | Net on a $10,000 account |
|---|---|---|---|---|---|---|
| Thunderhead | EUR/GBP H1 | 426 | 1.52 | 61.97% | -9.1% | $8,342.25 |
| Lattice Weave | GBP/AUD H1 | 501 | 1.51 | 46.31% | -7.83% | $10,280.42 |
| Cairn | EUR/USD H1 | 4,725 | 1.48 | 64.04% | -14.52% | $28,687.43 |
| Orrery | JP225 H1 | 210 | 1.46 | 58.1% | -0.67% | $386.05 |
| Zerqon | US30 H4 | 253 | 1.43 | 78.26% | -2.03% | $757.93 |
| Iridescence | EUR/USD H1 | 912 | 1.4 | 51.97% | -8.81% | $9,403.46 |
| Ballast | EUR/GBP H1 | 307 | 1.4 | 78.5% | -8.32% | $3,123.46 |
| Windrose | AUD/CAD H1 | 108 | 1.38 | 60.19% | -4.51% | $1,445.84 |
| Tidewell Slack | GBP/JPY M15 | 315 | 1.35 | 40.32% | -9.92% | $5,141.84 |
| Kestrel Hover | USD/JPY M15 | 291 | 1.33 | 31.27% | -7.11% | $4,930.4 |
| Lanternfish | USD/JPY M5 | 423 | 1.3 | 62.88% | -6.53% | $3,327.78 |
| Beacon | AUD/CAD M15 | 408 | 1.28 | 79.66% | -3.88% | $1,791.94 |
| Peregrine | BTCUSD H4 | 178 | 1.27 | 78.09% | -7.35% | $1,458.45 |
| Tessera | USD/JPY H1 | 645 | 1.27 | 50.39% | -5.15% | $3,212.05 |
| Test conditions | |
|---|---|
| Experiment ID | EXP-CATALOGUE-PROFITABILITY-001 |
| MT5 build | 6090 |
| Environment | MetaTrader 5 strategy tester, Exness-MT5Trial5 contract specifications |
| Symbol / timeframe | One symbol and timeframe per EA (see table) |
| Period | 2019-01-01 – 2026-08-09, per-EA windows vary |
| Model | Every tick generated from M1 bars (12 EAs); every tick based on real ticks (2 EAs) |
| Last verified | 2026-08-14 |
The derivation is reproducible: the per-EA rows above come from each EA’s published closed-trade list and its run manifest, recomputed by the script stored with experiment EXP-CATALOGUE-PROFITABILITY-001. How we test describes the listing gate every one of these records had to pass before it appeared here.
Two honest caveats sit on top of that table before any of it means anything.
This is a survivor set. These are the EAs that passed a listing gate. Nobody publishes the ones that failed it, here or anywhere else, so “14 of 14 are profitable” describes the shelf, not the workshop. The useful question is not whether the published ones are profitable — they are, by selection — but what their records say about the shape of that profitability.
None of this is live. Each EA carries a post-publication update block, and every one of them is a rolling backtest with a verified live run count of zero. Backtests bound what a strategy could have done under a recorded price history. They do not survive contact with a real spread at an unexpected moment, and the modelling quality is not even uniform across the catalogue: twelve use ticks generated from M1 bars, two use real ticks.
Profitable over the record vs profitable in the year you watch
Split the same trades by calendar year and the single-number verdict falls apart.
| Year | EAs trading | Finished the year in profit | Finished the year down |
|---|---|---|---|
| 2019 | 8 | 4 | 4 |
| 2020 | 9 | 7 | 2 |
| 2021 | 14 | 14 | 0 |
| 2022 | 14 | 13 | 1 |
| 2023 | 14 | 13 | 1 |
| 2024 | 14 | 13 | 1 |
| 2025 | 14 | 11 | 3 |
| 2026 | 13 | 12 | 1 |
Someone who started every one of these EAs in 2021 saw a clean sweep of winning years and would tell you EAs work. Someone who started in 2019 watched four of eight finish down, and someone who started in 2025 watched three of fourteen do the same. The programs did not change between those years. The market did, and the sampling window did.
That is the difference between the marketing claim and the record. A backtest headline reports the endpoint of a long window. A buyer lives inside a short one.
The distinction also shows up per EA rather than only per year. Tessera returned $3,212.05 in total but finished 2019 down $221.11 and 2026 down $72.05. Peregrine ends its record up $1,458.45, with $1,240.20 of that arriving in a single year, 2024, and a loss of $274.90 in 2025. A record can be genuinely profitable and still deliver most of its result in a stretch you would have had to be present for.
What to look for before you trust a profit factor
Four things separate a number that means something from a number that just looks good.
1. The waiting time, not just the depth. Max drawdown tells you how far down the equity went. It does not tell you how long you sat there. On this catalogue those two come apart completely: Orrery has the shallowest drawdown of the set at -0.67% and the longest wait of all at 775 days, while Cairn has the deepest at -14.52% and recovers in 160 days. Ask both questions.
2. Win rate is not the answer. Kestrel Hover wins 31.27% of its trades and posts a profit factor of 1.33. Beacon wins 79.66% and posts 1.28. A high win rate means the losses are larger relative to the wins, not that the strategy is better — the ratio and the hit rate are two ends of the same dial.
3. The losing streak you have to hold through. The median worst streak here is 6 consecutive losing trades and the longest is 14, on Cairn — an EA that nonetheless produced the largest net result of the catalogue. If a run of 14 losses would make you switch it off, its profit factor is irrelevant to you. This is what worst streak is for.
4. Trade count, and what the account size means. Orrery’s 1.46 profit factor rests on 210 trades and produces $386.05; Cairn’s 1.48 rests on 4,725 trades and produces $28,687.43. Same ratio, two orders of magnitude apart in outcome, because a ratio says nothing about how often it is applied or at what size. Per-EA net figures here are all denominated in a $10,000 test account and are not additive into a portfolio result.
Running one in practice
Day-to-day operation of an EA is mostly not intervention. It is deciding in advance what would make you stop.
- Before you start, write down the drawdown and the losing streak you will accept. Take them from the published record of the EA you chose, not from a round number. If the record shows a 14-trade losing streak, 8 losses in a row is not a reason to intervene — it is inside the documented behaviour.
- While it runs, compare against the published record rather than against zero. An EA that is down 4% is not malfunctioning if its record contains a -9.1% drawdown. An EA that is down 20% when its record maxes out at -7.35% is a different conversation.
- When to stop is the part worth deciding while nothing is happening. The useful trigger is a behavioural break — a drawdown deeper than anything in the record, a trade frequency that stops matching the documented rate — not an emotional one.
- Costs are not in the ratio. These backtests apply the spread and specifications of one broker’s contract set. Swap, slippage on news, and a wider live spread all subtract from the same edge, and none of them appear in a profit factor computed on a tester.
- Where to watch it. The Experts tab of the Terminal window carries the EA’s own log lines and the Journal tab carries the terminal’s execution record — those two are where a silent EA explains itself. AutoTrading has to be on in two places, the toolbar button and
Tools > Options > Expert Advisors > Allow Algo Trading; an EA that “isn’t trading” is far more often one of those switches than a broken strategy. - If you re-run the record yourself, the tester Model field is not optional detail. Set it to the same model the record used —
Every tick (generated from M1 bars)for twelve of the fourteen,Every tick based on real ticksfor Kestrel Hover and Ballast — with a 10,000 deposit and the leverage stated on the EA page. Changing that one dropdown changes the fill prices, so a “different” result is usually a different test rather than a different EA.
If you want to change what the EA does rather than only whether it runs, the Builder is where the logic is editable, because rebuilding a rule set is a different exercise from tuning inputs on a compiled EA.
Risk and drawdown reality
Three limits are worth stating plainly:
Past results do not carry forward. Every figure here is measured on price history that already happened, with the trades known in advance to the person choosing the test window. A profit factor of 1.5 is a description of 2019–2026, not a forecast of 2027.
Backtest is not live. No EA in this catalogue has a verified live run. The gap between a tester and an account includes requotes, variable spread, execution latency and swap — all of which move in the direction that costs money.
Selection shapes what you see. The reason every published EA looks acceptable is that the unacceptable ones were not published. This applies to every vendor’s shelf, including this one, and it is the single most important thing to hold in mind when a page tells you that all of its EAs are profitable.
None of that makes automated trading pointless. It makes the honest claim a narrow one: a documented EA gives you a rule set whose historical behaviour you can inspect in full, including the parts you would rather not see. That is more than a discretionary approach usually offers, and it is less than a promise of profit. There is no guarantee of any result, and losses are part of every record on this page.
Next steps
If you want to work from a record rather than a claim, browse the verified EAs — each one publishes the complete closed-trade list, drawdown and run manifest behind the numbers quoted here, so you can check the waiting time and the losing streak before you commit anything.
If you are weighing this against trading by hand, EA vs manual trading replays these same records under the stop rules a discretionary operator would actually use — switching off after three losing trades in a row would have given up most of the result quoted on this page.
If you would rather build the rules yourself and test them the same way, start in the Builder and read how a grid differs from a martingale first, because the strategy family you choose decides the drawdown shape you will have to live with. Creating an EA without coding walks the whole path and reports what the shipped starter templates score before you edit them — the same survivor-set question, asked one step earlier.
If the EA you are weighing came free from somewhere else, the questions change before they get to profit factor. How to use a free EA sets out the four checks in the order that disqualifies fastest, and grades our own free template gallery against them — none of the 53 measured designs there clears the pass bar the Builder prints for a user’s own build.
Once you have picked one, the waiting times on this page become a sizing problem. Risk management for EA traders turns the same records into a deposit and a lot size, and reports that every listing here recommends the same 10,000 minimum for EAs whose worst drawdown ranges from 0.67% to 26.5% of it.