At a glance
NAS100 · The Nas
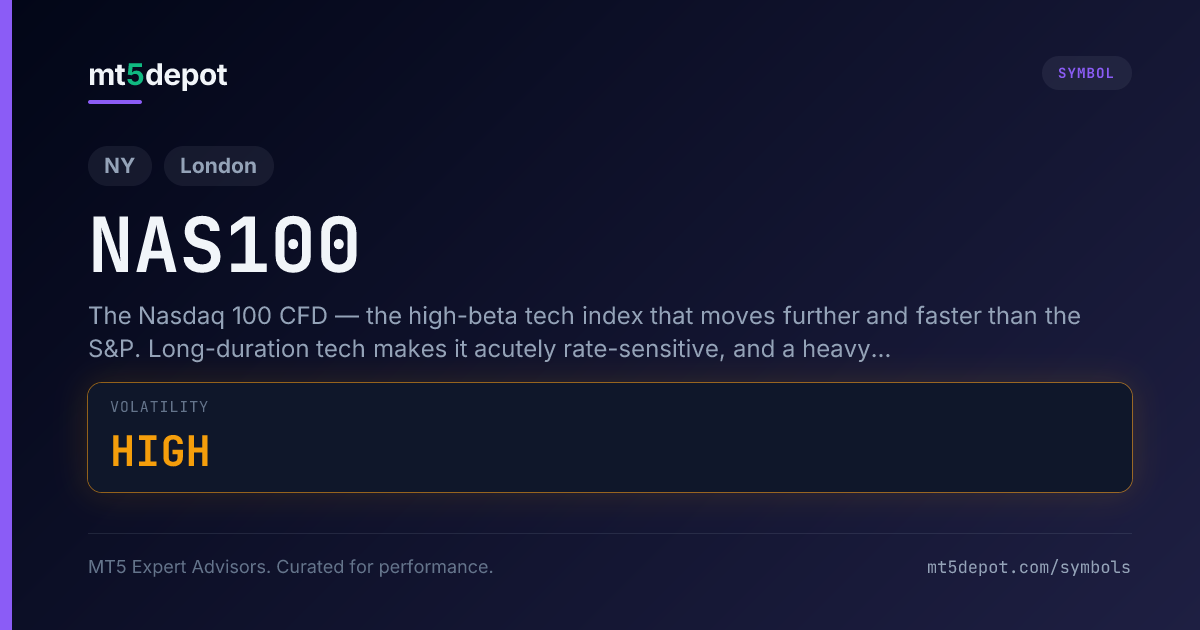
The Nasdaq 100 CFD — the high-beta tech index that moves further and faster than the S&P. Long-duration tech makes it acutely rate-sensitive, and a heavy mega-cap concentration means a single earnings miss can swing the whole index. Big ranges reward trend and breakout EAs that are sized for the volatility.
Typical values — NAS100 is not yet measured broker-by-broker; confirm the live spread and point value on your own account.
Data
Trading conditions
Session windows, broker spreads, and cost math for this symbol — measured and typical values, not marketing.
EA catalogue
EAs for NAS100
Why this list is empty
Our catalogue lists no NAS100 EA right now. An EA is listed only after it passes our tick-data backtest gate — and the numbers are published either way. Until then, build and test your own below.
- Listing is gated, not editorial — an EA reaches this page only after it passes our tick-data backtest gate.
- The numbers are published either way, including the EAs that failed the gate and were delisted.
- You can build your own NAS100 EA and backtest it on this symbol before anything goes live.
Analysis
NAS100: the full analysis
The Nas is not a currency pair. It is the Nasdaq 100 stock-index CFD — a concentrated basket of the largest US technology companies, traded as a single instrument. It is the highest-beta of the US indices: the same macro move that nudges the S&P 500 travels further and faster here. Long-duration tech reprices harder, and a handful of mega-caps carry the whole index. The first thing to decide is whether your strategy wants that character or merely tolerates it. A trend or breakout EA feeds on the Nas’s large range, while a system sized and stopped for the S&P meets a bigger move the moment it touches NAS100.
This page covers what the Nas gives an automated strategy that a forex pair or a calmer index does not, the sessions that decide its results, and what it costs — including the overnight financing FX has no equivalent for. It then covers the failure modes that catch systems moved over from the S&P, and how to test a NAS100 EA when there is no off-the-shelf one to copy.
How NAS100 Behaves: What The Nas Gives an EA
The Nasdaq 100 tracks the hundred-odd largest non-financial companies on the Nasdaq exchange. It is structurally different from a forex major — and even from the broader S&P — in ways that matter more for automation than any indicator choice. Its catalysts are corporate earnings and interest rates, not an interest-rate differential between two economies. Its arithmetic is index points and a broker-set point value, not pips.
For an EA, that character reduces to three properties:
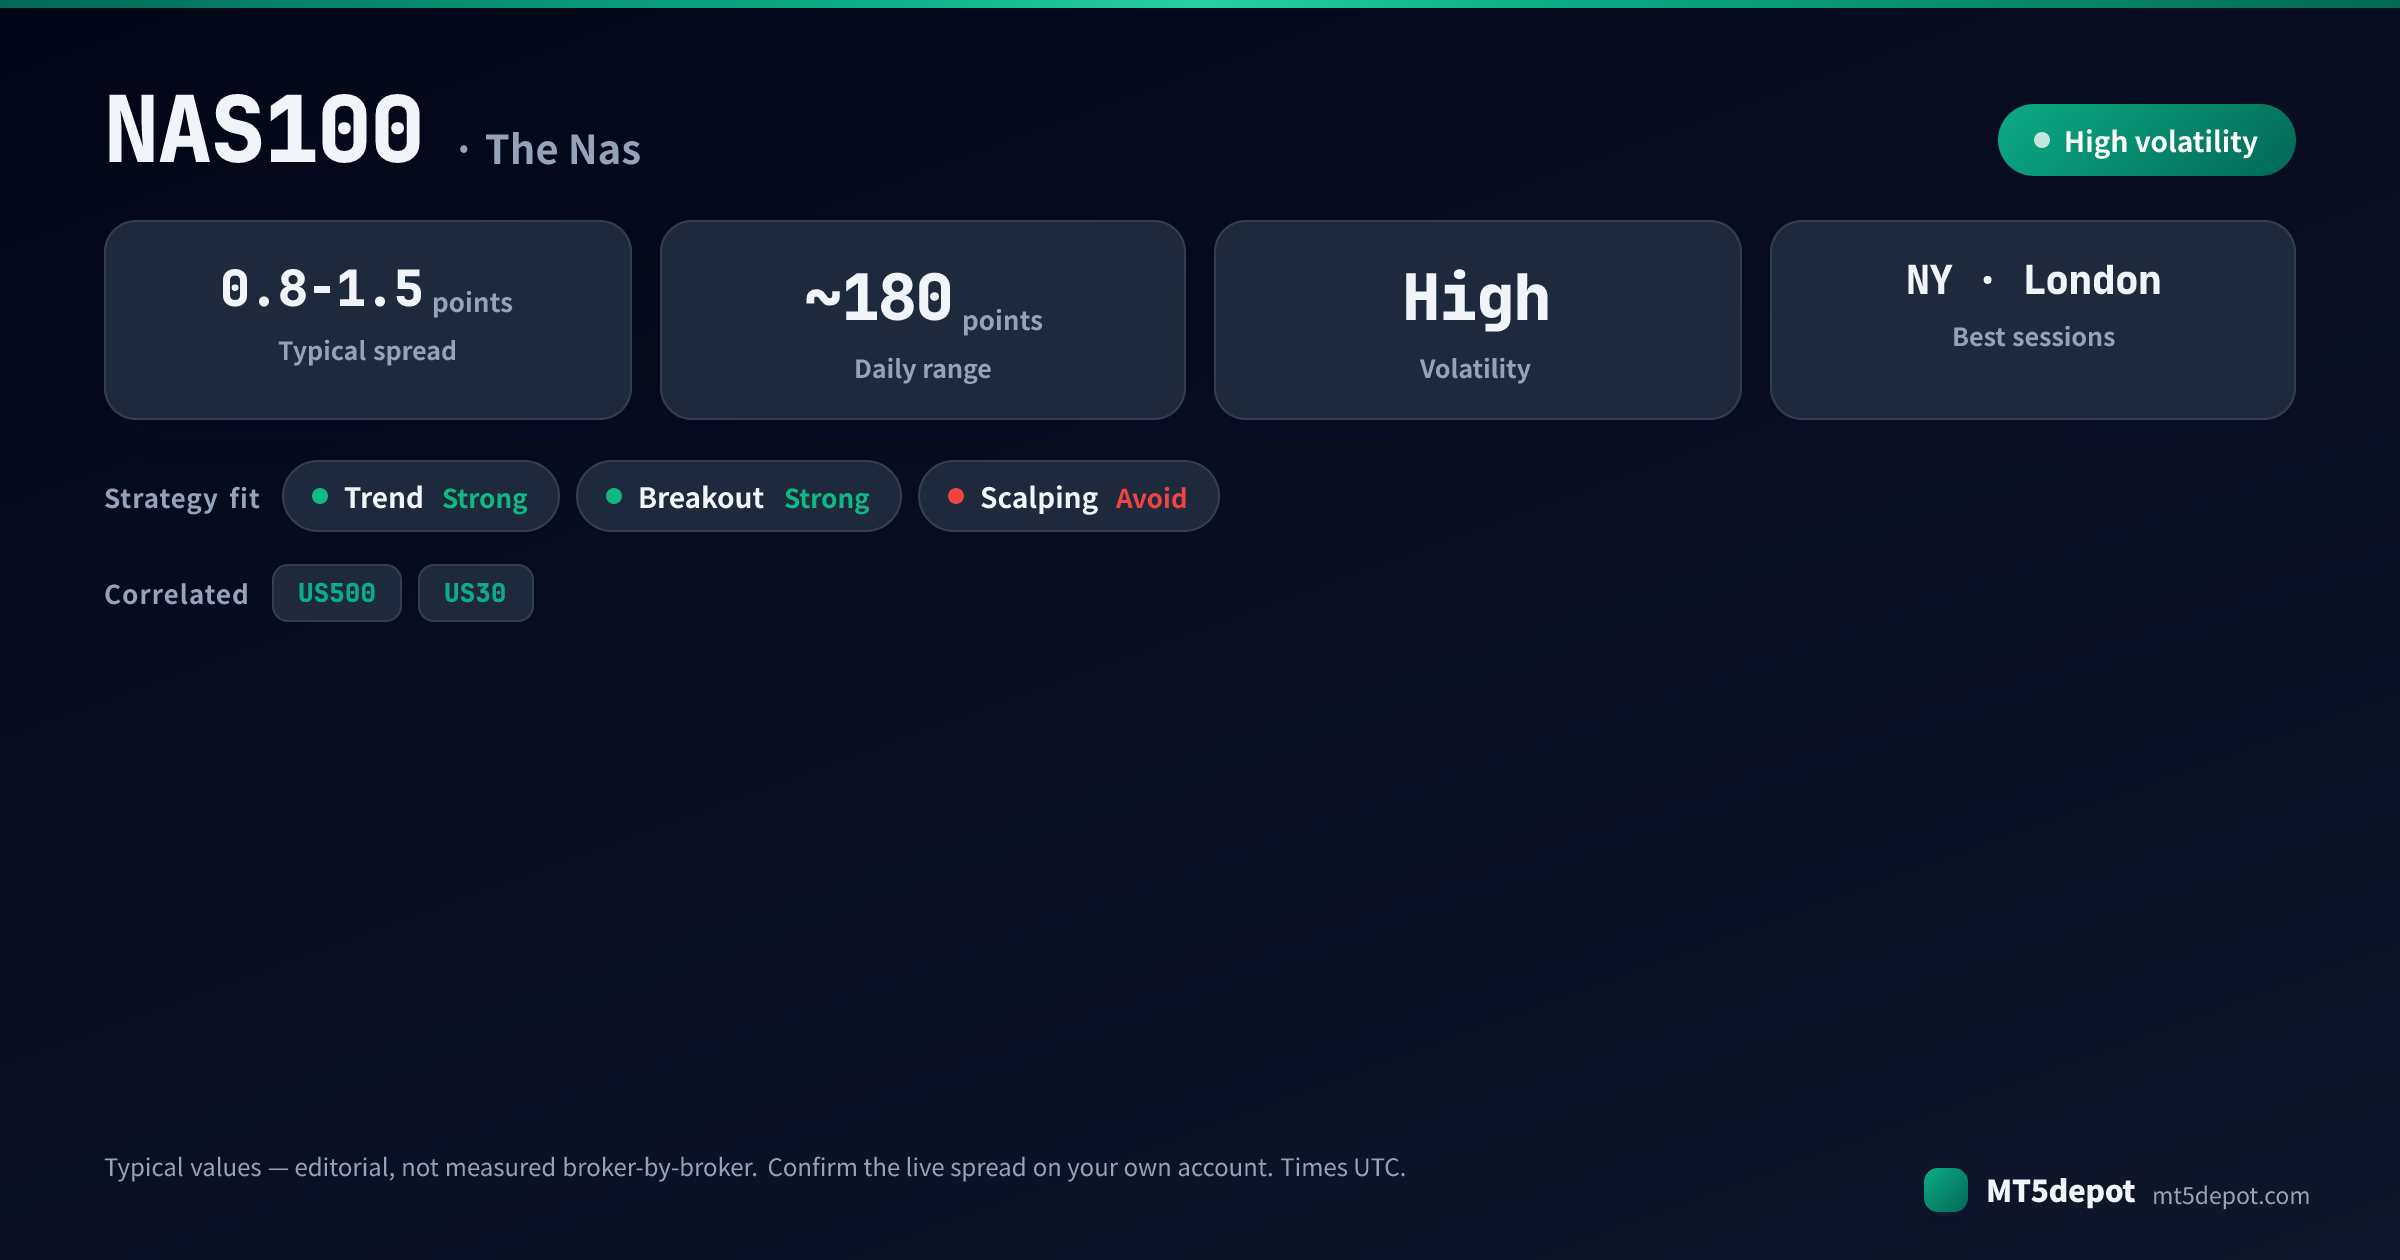
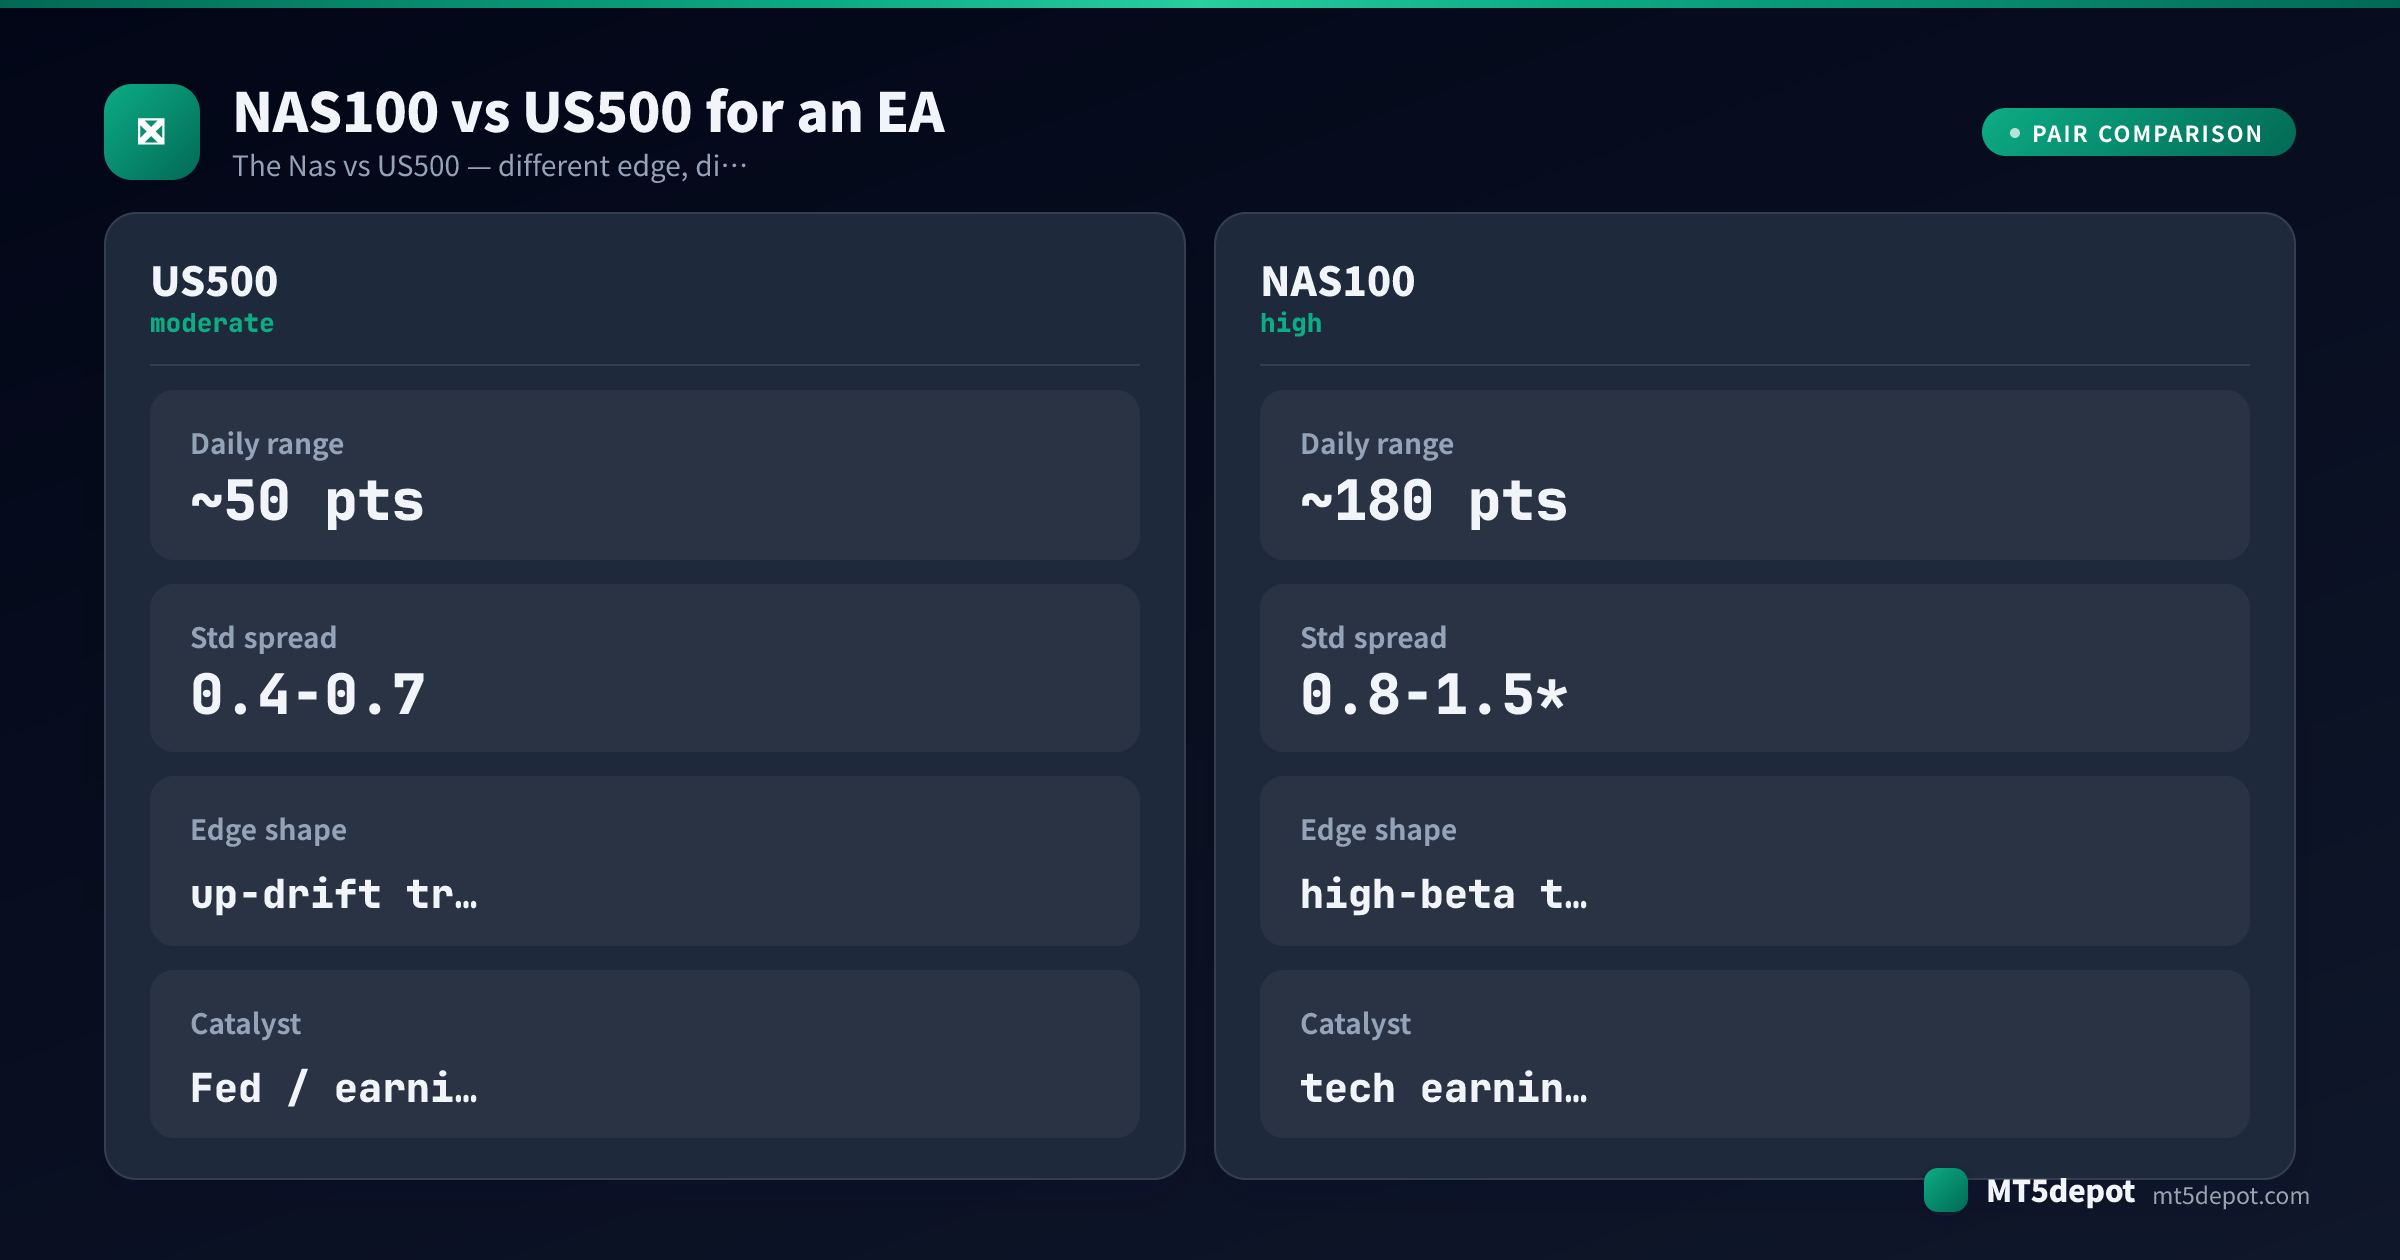
- The highest-beta index, with a wider range. Our published typical daily range for the Nas is near 180 index points — labelled typical, not measured broker-by-broker. What matters is relative: the same risk-on or risk-off move that the S&P registers as a modest swing shows up on NAS100 as a larger one. The Nas concentrates the high-growth names that lead those moves. Re-sizing stops and targets to the Nas’s own range is the fact everything else here follows from — an S&P-sized stop copied across gets run over by an ordinary Nasdaq session.
- Acute rate sensitivity. The Nas is a book of long-duration growth stocks, whose valuations depend heavily on future cash flows discounted back to today. A rate surprise — a hot inflation print, a hawkish central-bank line — reprices those future cash flows hard. NAS100 can therefore move sharply on a rates headline that has nothing to do with the equity earnings calendar. A trend EA reading price alone often has no idea the driver behind its position has just changed.
- Mega-cap concentration. A small number of trillion-dollar technology names carry a large share of the index weight, so a single one of them missing on earnings can swing the whole index in one session. That is a source of gap risk a diversified basket does not carry, and it lands outside the regular data calendar — reported after the US close.
The trap for automated strategies is that the Nas’s large, clean range looks like an easy edge on a backtest. That same range, plus rate sensitivity and single-name concentration, means the instrument gaps and reprices at exactly the moments an EA concentrates its trades. The Nas rewards strategies that respect its volatility regime and its point arithmetic, and quietly ruins ones that treat it as the S&P with a bigger number.
Which EA Strategies Suit NAS100?
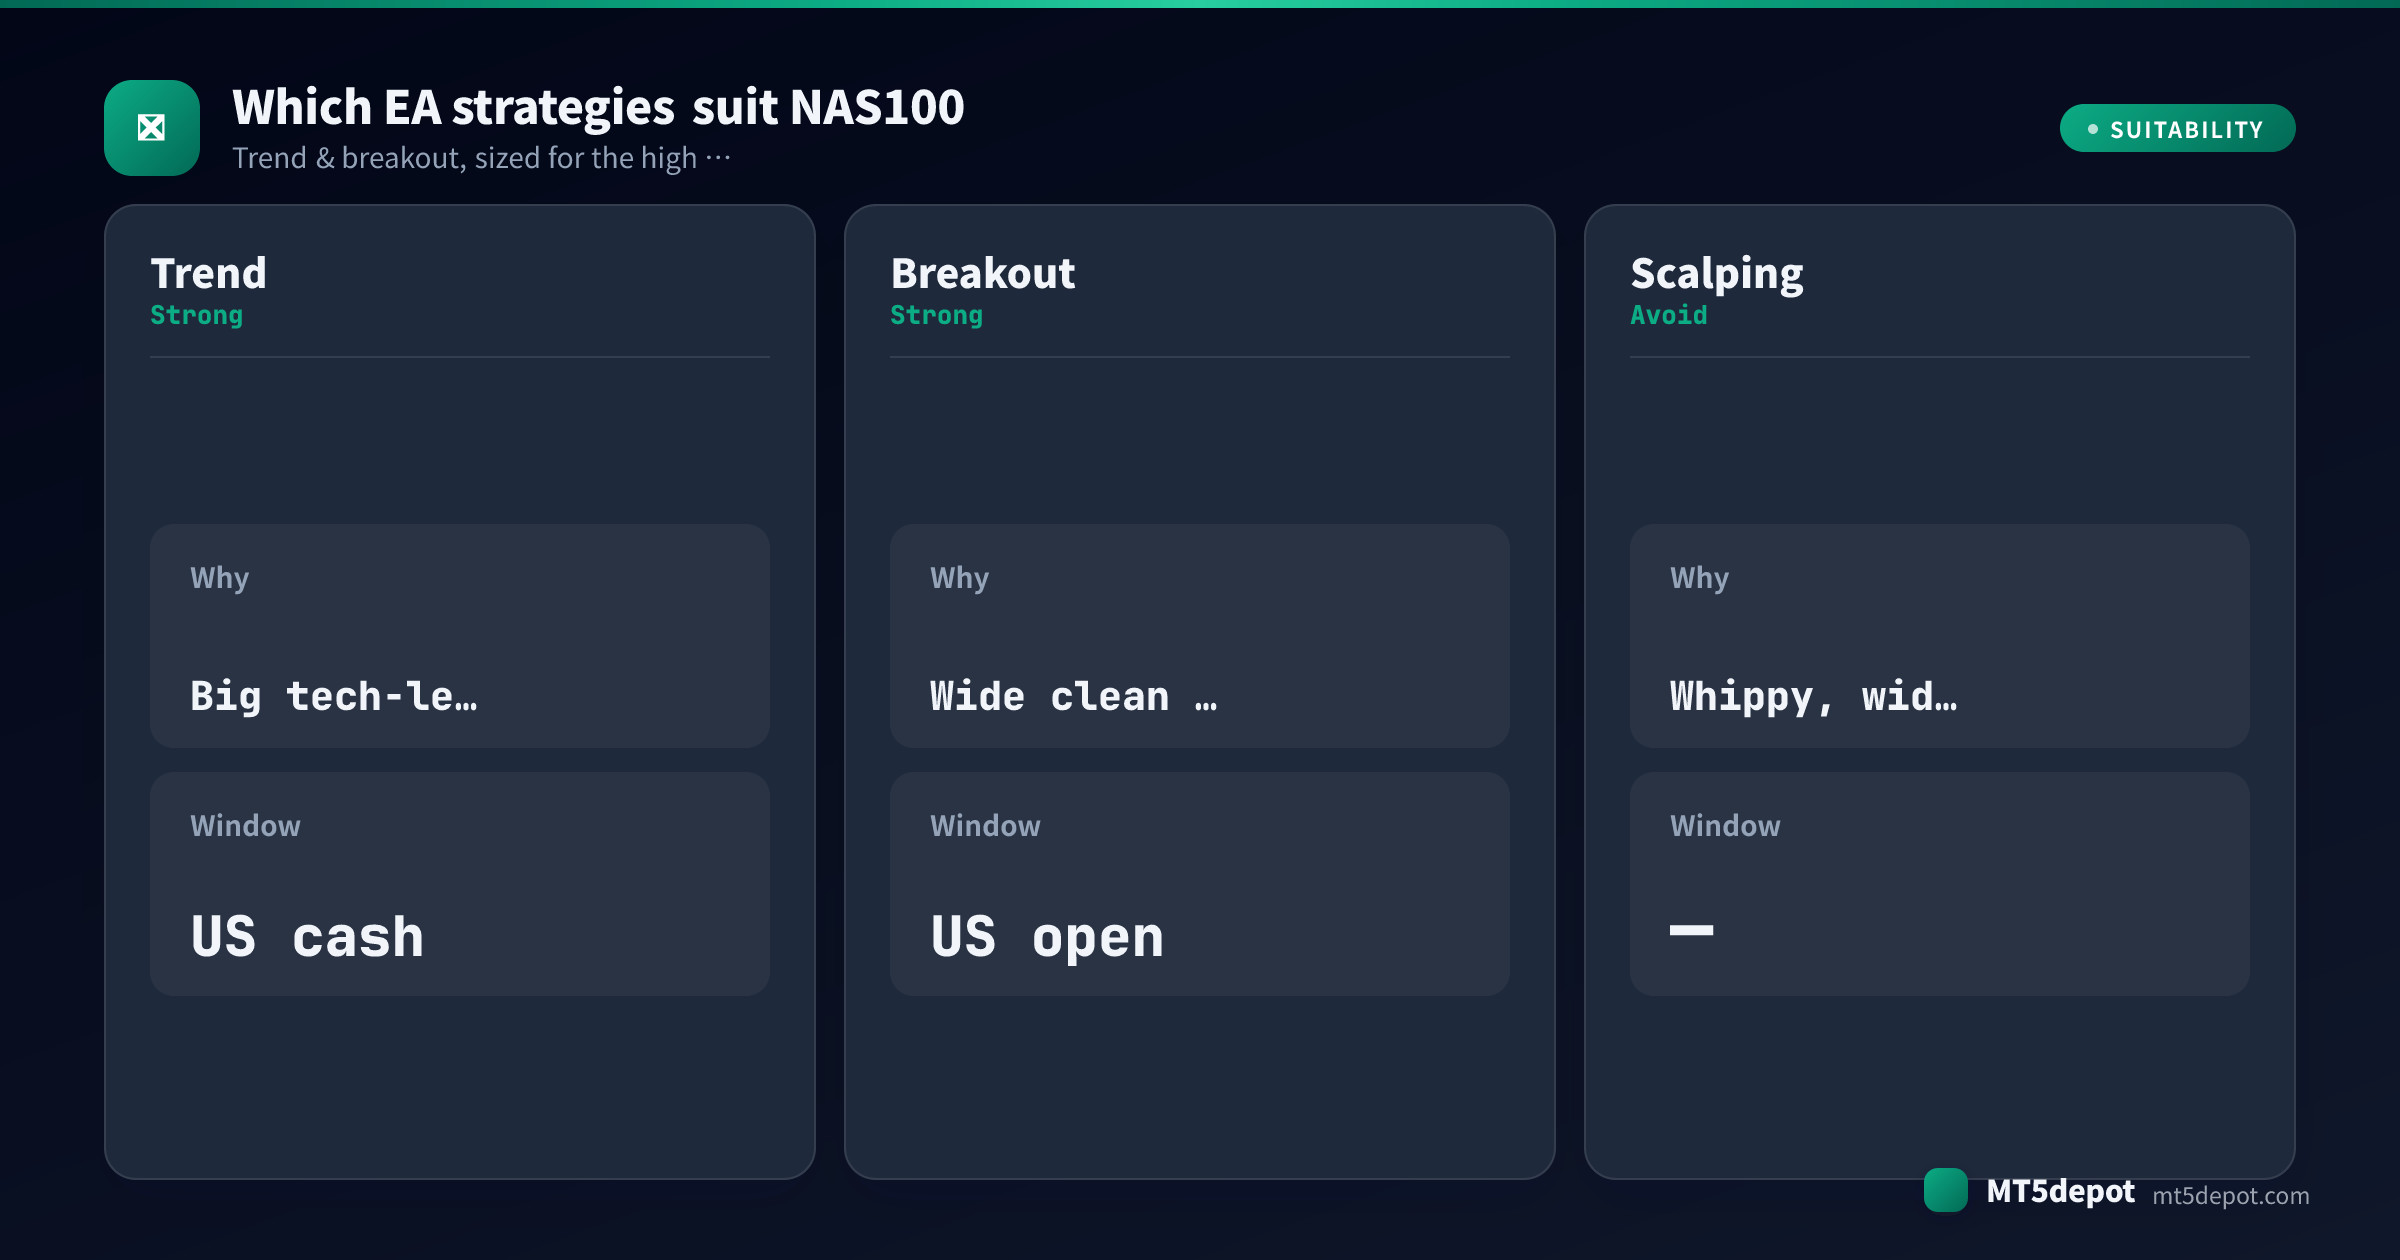
The instrument’s profile lists trend and breakout as suitable — but suitability is an editorial assessment, not proof. In a like-for-like template baseline (default inputs, no optimisation), most strategy templates finish below a 1.0 profit factor on any instrument. The ones that clear it usually earn it through mechanics — timeframe, session windows, sizing discipline — not the indicator on the box. What the Nas’s character tends to support:
| Strategy | Fit on NAS100 | Why |
|---|---|---|
| Trend | Strong | The Nas produces big, tech-led directional moves in the US cash session; momentum systems on M15/H1 have room for a 2:1 or 3:1 target to fill. |
| Breakout (pending orders) | Strong | The US open resolves the overnight range into wide, clean moves. Pending-order entries at the range edge are less spread-sensitive than market fills, which matters when volatility widens the spread on the break. |
| Scalping | Avoid | The Nas’s fast, whippy swings punish the tight stops a scalper relies on, and its wide intraday excursions turn small targets into coin-flips — the cost-and-noise math rarely clears. |
| Multi-index basket | Handle with care | NAS100 is available as a leg in the Builder’s templates, but its correlation with US500 and US30 is covered below — a “diversified” index basket is closer to one leveraged risk-on bet than a hedge. |
Trend and breakout on the higher timeframes are the shapes that turn the Nas’s beta into an asset. There is no NAS100-specific catalogue EA yet, so the practical route is to build one of these shapes yourself. The Builder ships templates that accept NAS100 and exposes every parameter — then test it (below) before you trust a single number.
Best Trading Hours for NAS100 EAs
Session structure decides more of a Nas result than indicator choice does:
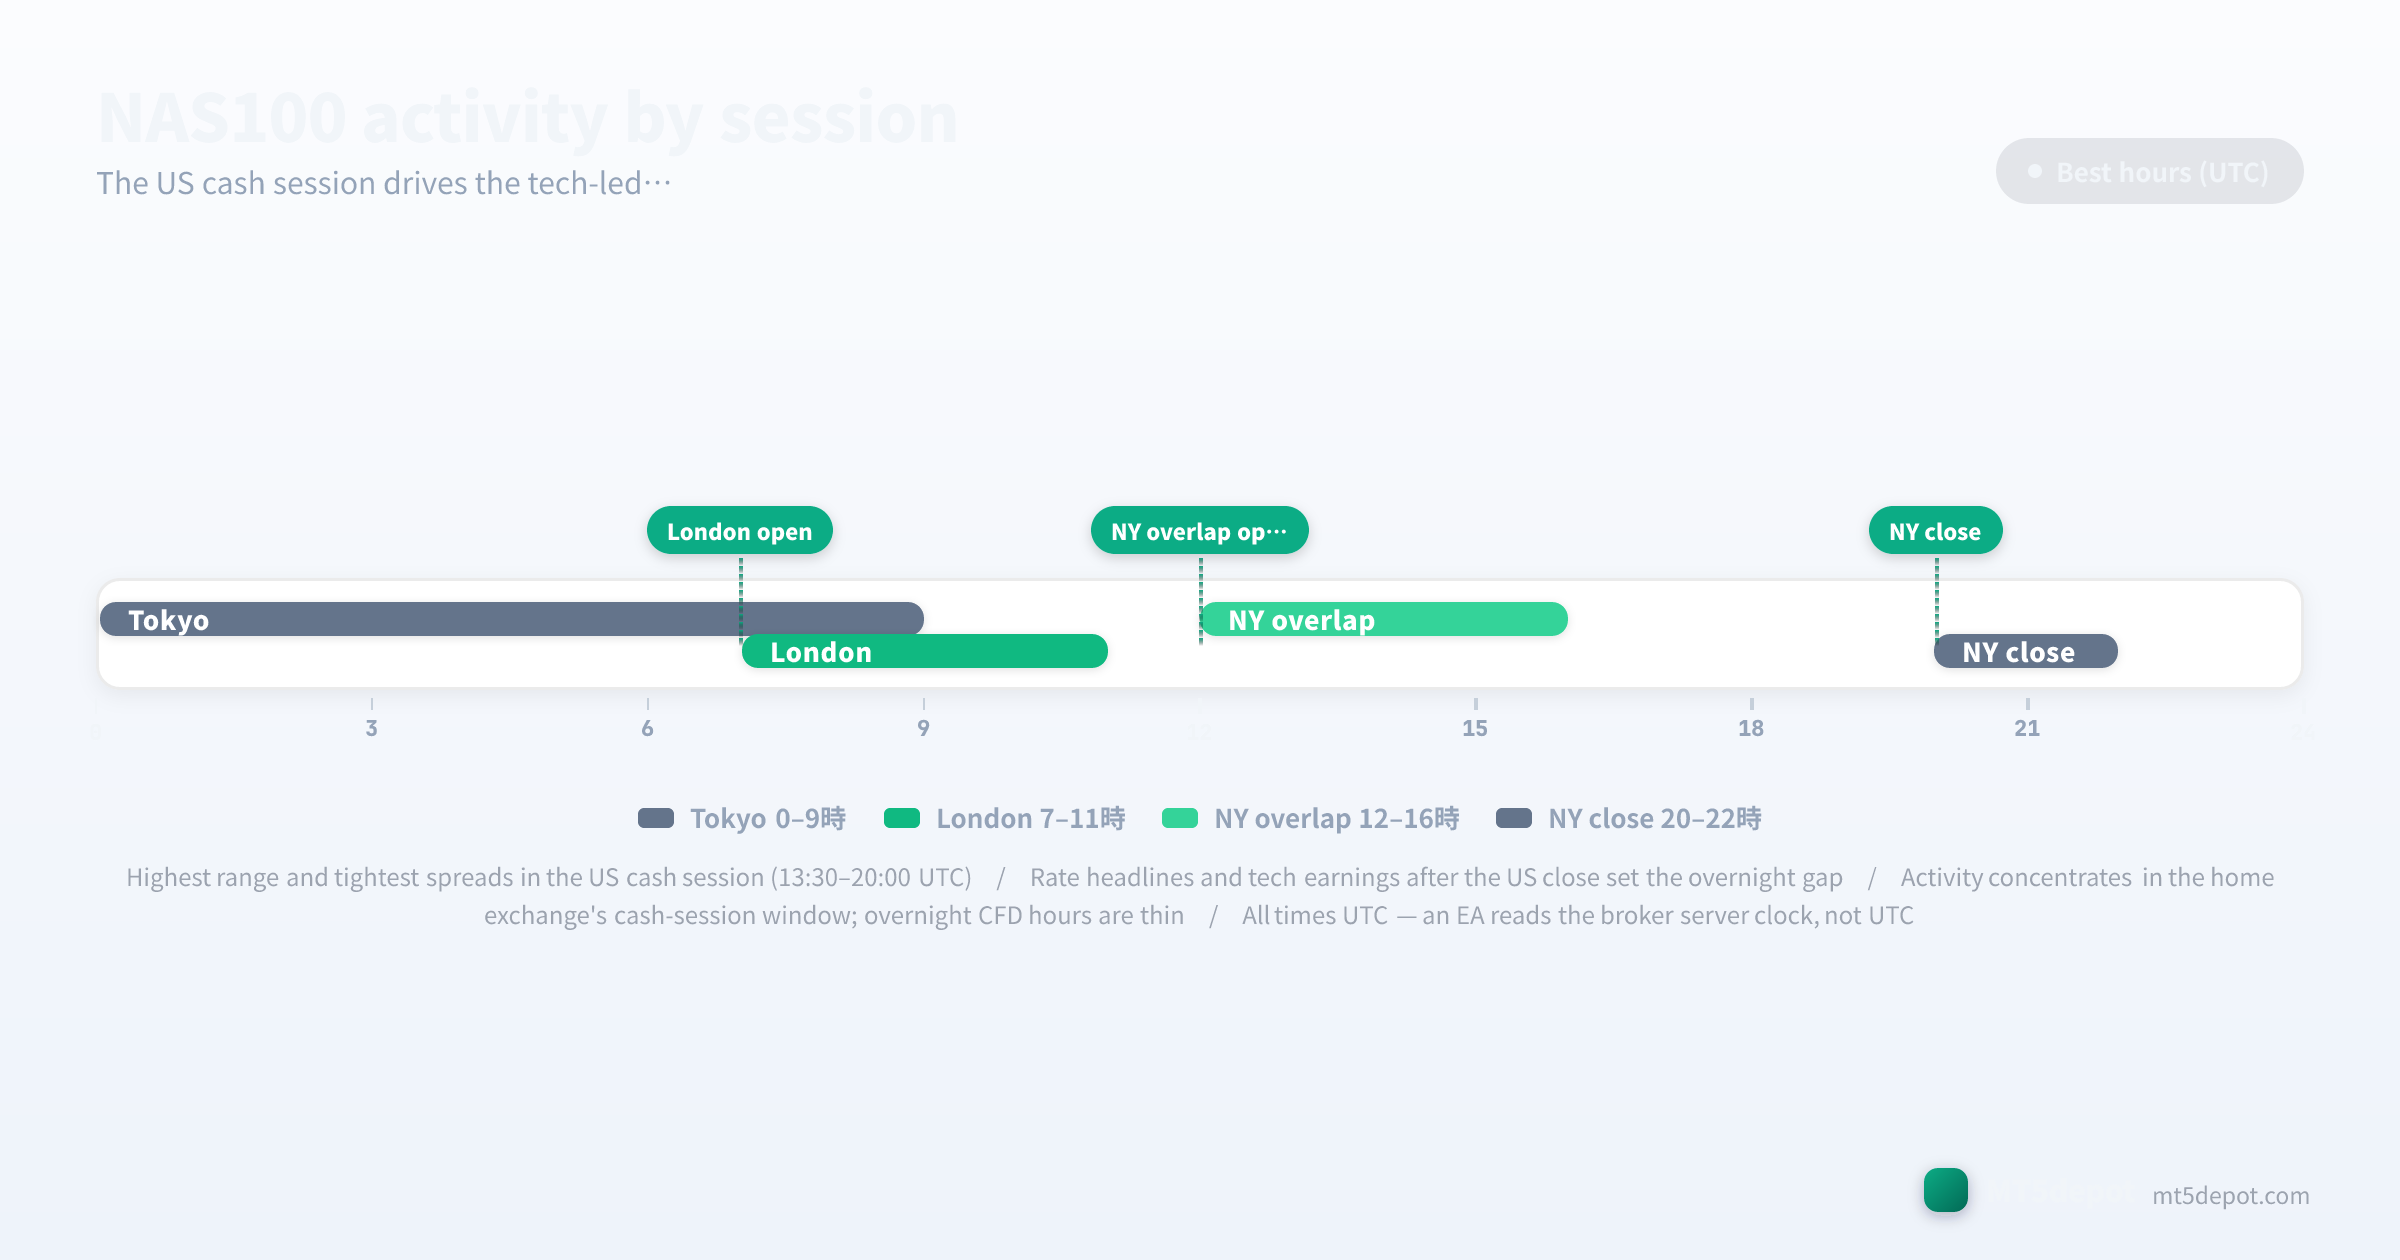
- Asian and early-London hours (roughly 00:00–13:00 UTC): thin index liquidity and low conviction. The Nas often drifts or chops in a narrow range while the underlying US market is closed. Moves printed here frequently reverse once the cash session opens — a window a session filter is usually right to exclude.
- US cash session (13:30–20:00 UTC): the Nas’s primary window. This is when the underlying stocks actually trade, so range is highest and spreads are tightest. Trend and breakout EAs on the Nas earn most of their result in these hours. The first hour after the open is typically the most volatile stretch of the day.
- US close and after-hours (20:00 UTC onward): liquidity thins and the biggest single-stock catalysts land. Mega-cap earnings are released after the close, setting up the overnight gap covered below rather than a tradeable trend.
Two cautions come with a session filter. Scheduled rate events — FOMC decisions, US inflation prints — sit inside the cash session and widen the Nas spread exactly then. A fast strategy needs a news pause, or it pays several times the normal spread at the worst moment. And every clock time above is UTC. An EA reads your broker’s server clock, which is usually not UTC, so a “13:30” cash-open filter shifts silently when you move the EA between brokers on different server timezones. Verify it once in MT5’s Market Watch, and every session boundary lines up.
Spreads, Costs, and Execution
The Nas has a cost structure a forex EA does not fully model, because a stock-index CFD carries an overnight financing charge on top of the spread. The figures below are editorial reference ranges in index points, compiled from broker-published index-CFD conditions (updated July 2026), not broker-by-broker measured numbers; our live spread sampling currently covers a few FX reference symbols. Confirm the live spread and point value on your own account before you size a fast strategy:
| Cost component | Typical NAS100 figure | Notes |
|---|---|---|
| Spread | 0.8 – 1.5 points | Tightest in the US cash session; widens on the open and around rate events |
| Commission | account-dependent | An account property, not an instrument property — the same rate applies whichever index you trade |
| Overnight financing | charged at daily rollover | A holding cost with no forex-pip equivalent; longs pay it, and it compounds against slow trends |
Two cost rules specific to this instrument:
- Cost is measured in points, never pips — and financing is part of it. A stock-index CFD is not a currency pair, so its spread and range are quoted in index points. A long position held past the daily rollover also pays a financing charge that FX cost models ignore entirely. For a slow, multi-day trend EA that is a recurring drag which can turn a marginal historical edge into a live loss, so it belongs in the backtest.
- Confirm the point value, because absolute swings are large. The dollar cost of a given move depends on the broker’s point value for the contract, and the Nas’s swings are large in absolute points. A spread or a stop that looks small in points can be a meaningful cost in account currency. A strategy validated on one broker’s contract specification is a different strategy on another’s.
Risks to Test Before Going Live
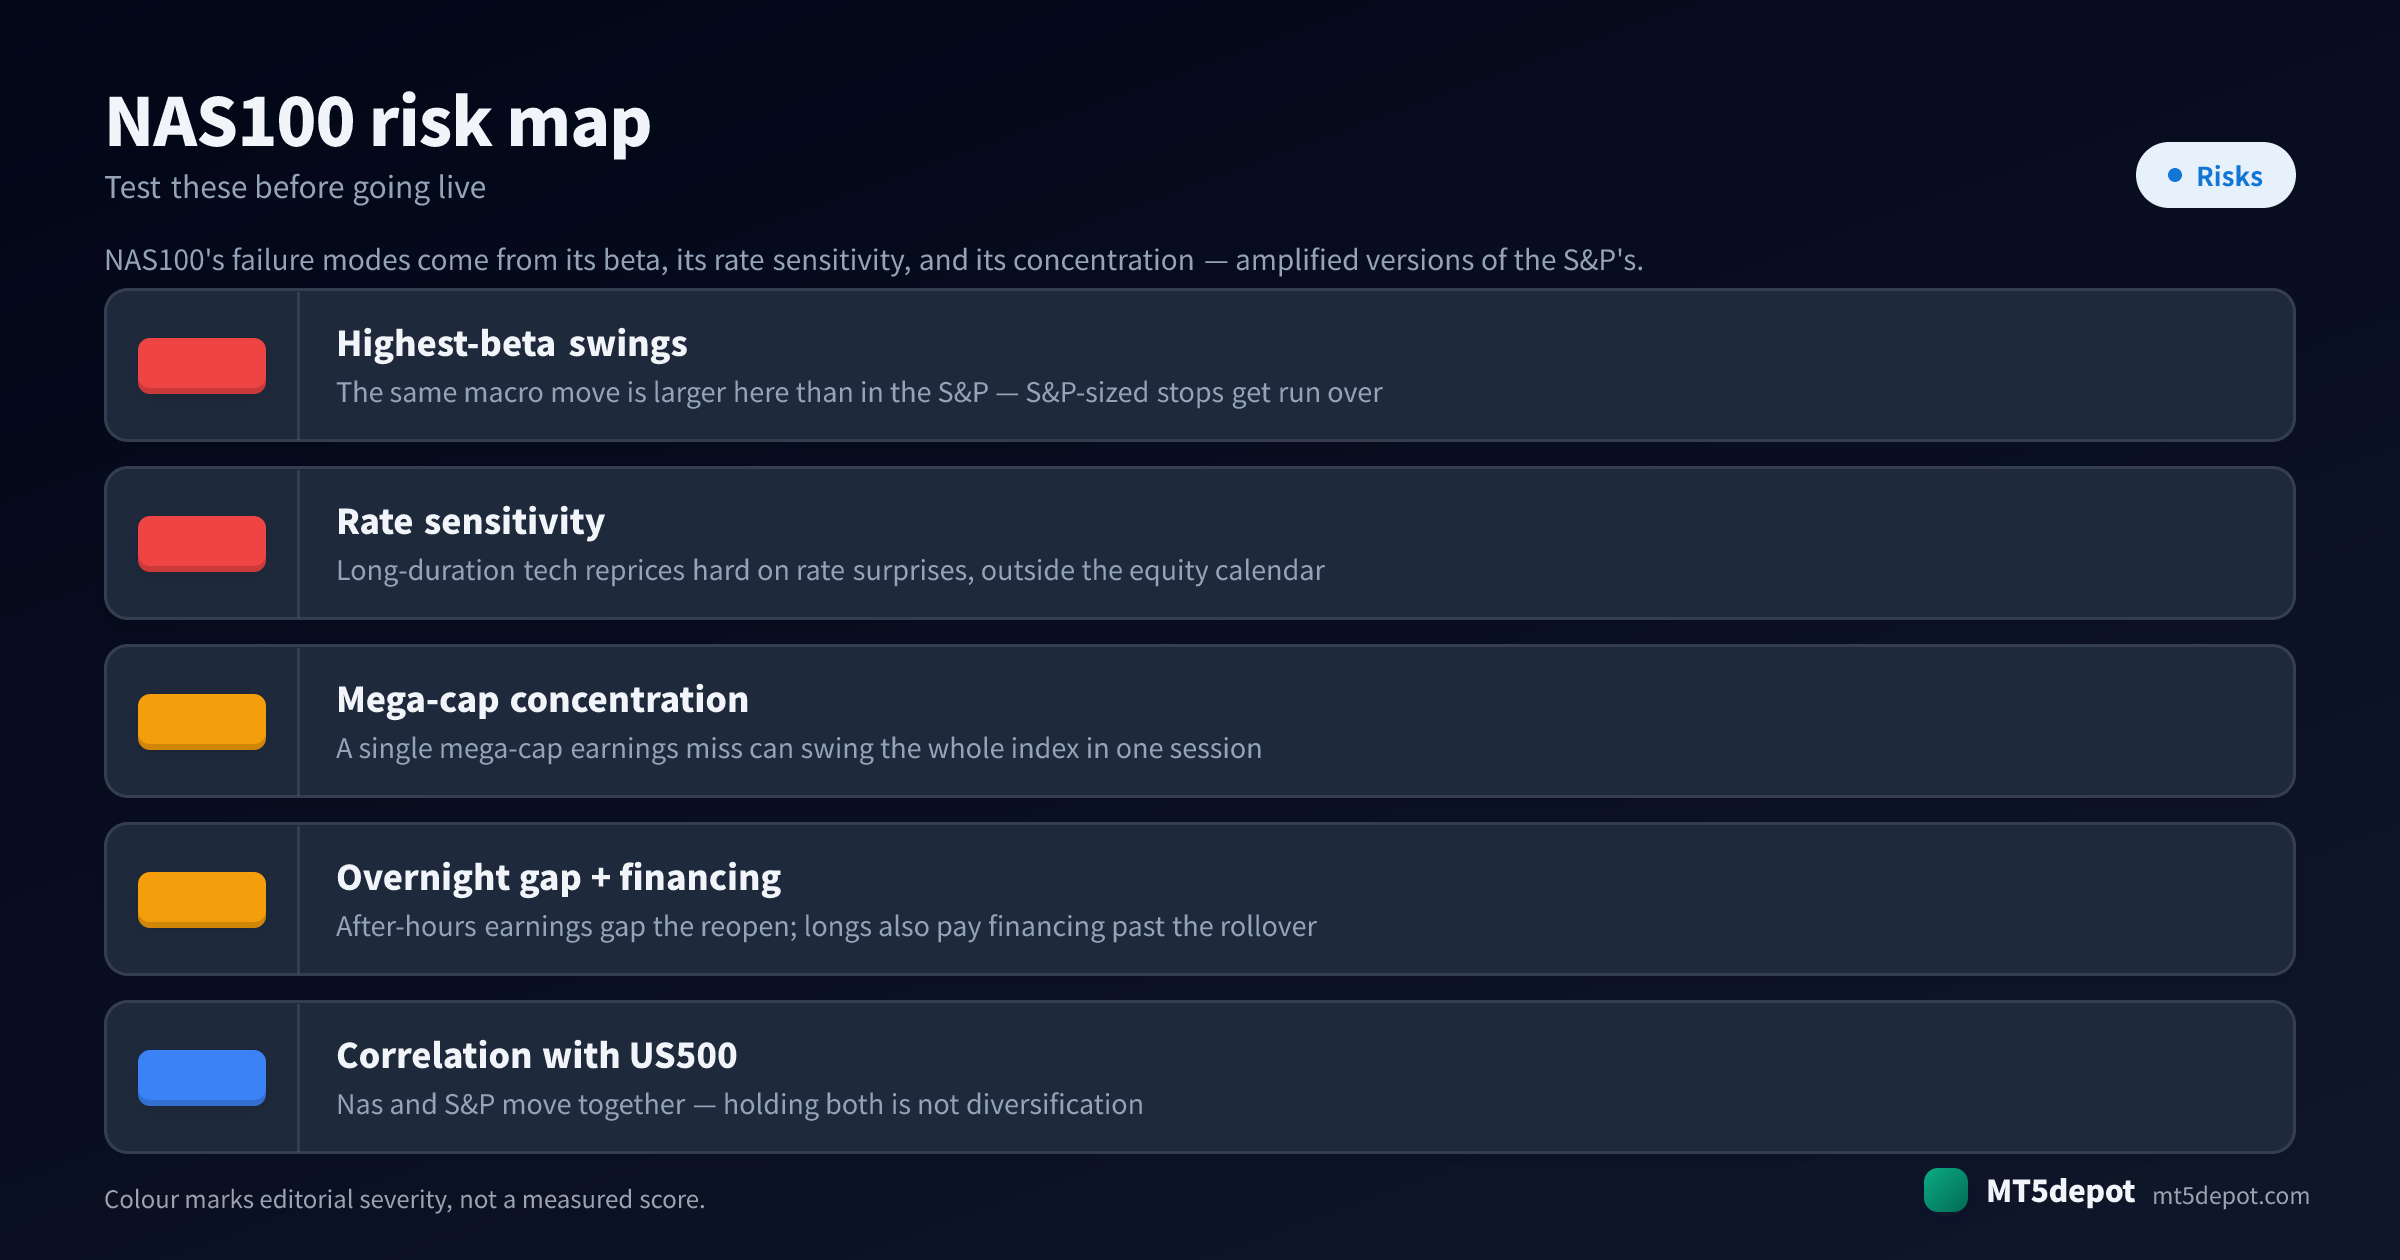
The Nas’s failure modes come from its beta, its rate sensitivity, and its concentration — amplified versions of the S&P’s. A generic risk checklist misses most of them:
- Highest-beta swings run over S&P-sized stops. The same macro move is larger on the Nas than on the S&P. A fixed stop carried over from an S&P system sits inside the Nas’s normal noise and gets hit before the thesis has room to play out. Re-size stops and targets to the Nas’s own range and ATR, not to a number that worked on a calmer index.
- Rate surprises reprice the index outside the equity calendar. Long-duration tech reprices hard on a rates headline — an inflation print, a hawkish surprise — that has nothing to do with earnings season. A trend EA with no volatility or news filter can hold straight into a repricing the equity calendar gave it no warning about.
- Mega-cap concentration is single-name gap risk. A single trillion-dollar constituent missing on earnings can swing the whole index in one session. Because that catalyst is a company report, not a scheduled economic event, a data-calendar news filter will not catch it — the position is exposed to one company’s number.
- The after-hours earnings gap the reopen. Big-tech earnings land after the US close, so the index can gap sharply at the next reopen before a stop can act. An unfiltered EA holding through the after-hours window is exposed to a move it cannot exit at its stop price. Model the gap; do not assume the stop fills where it sits.
- Financing drags on any slow long trend. A long position held past the daily rollover pays a financing charge with no forex equivalent. A slow trend edge that looks positive on price alone can be net-negative once that cost compounds. Include financing in the backtest before you trust a multi-day trend result.
- Correlation with US500 is hidden leverage. The Nas and the S&P move together on the same drivers. Two “diversified” EAs on NAS100 and US500 are closer to one leveraged risk-on bet than a hedge. The correlation doubles your exposure without appearing anywhere in either EA’s risk settings.
How to Test a NAS100 EA
Because there is no catalogue Nas EA to lean on, the test is the whole edge. Hold anything you build to the same bar our catalogue EAs publish under the site’s methodology:
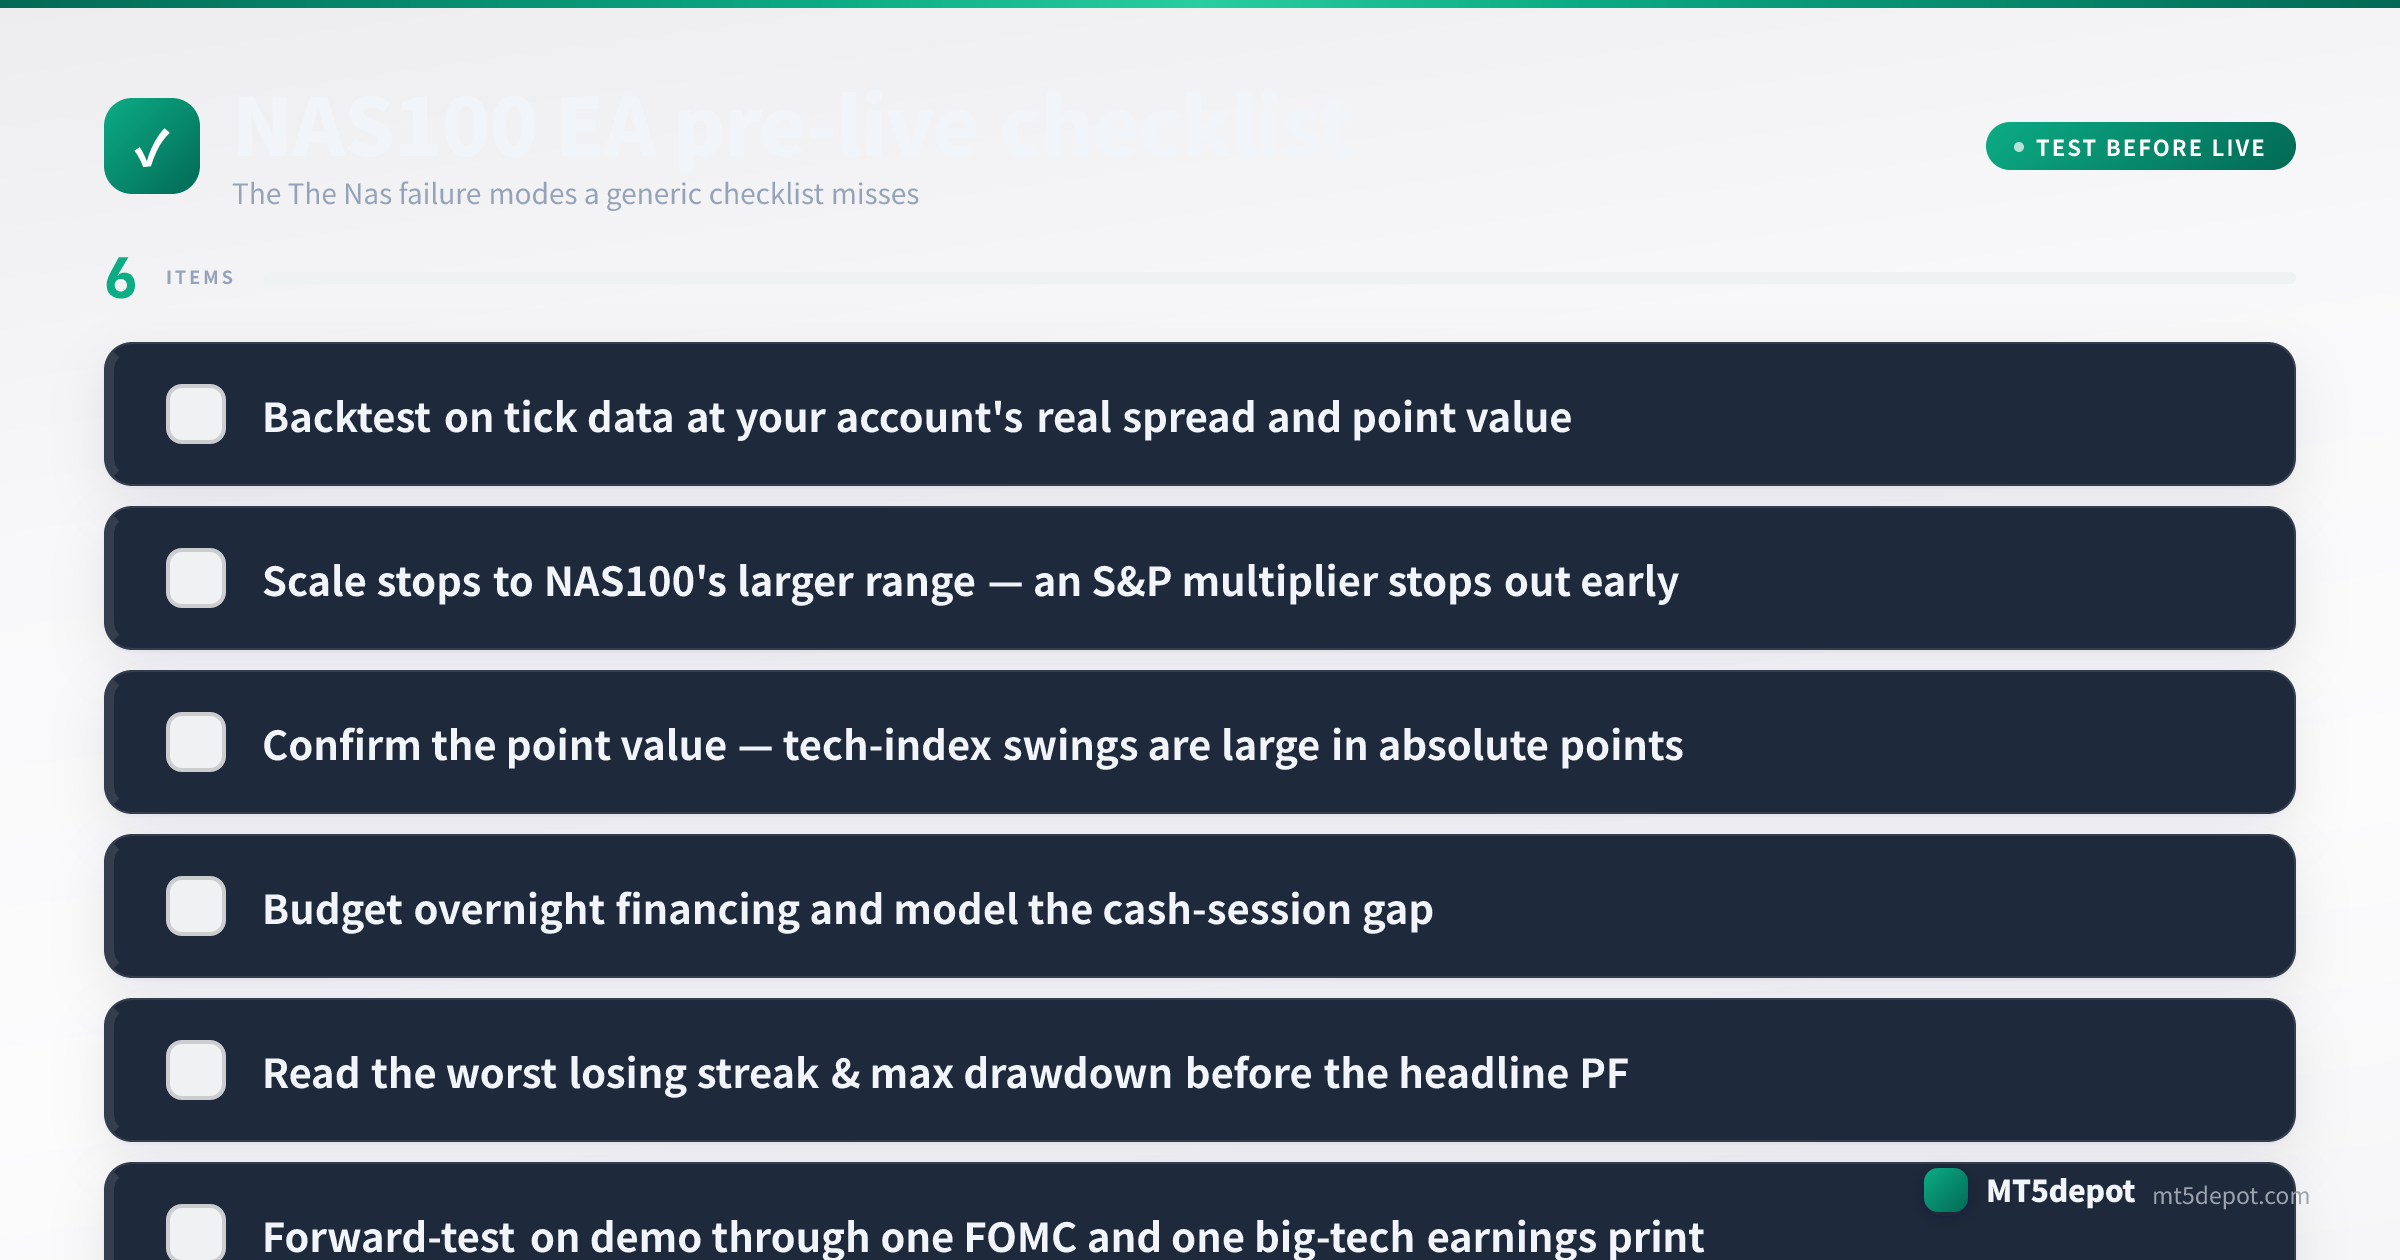
- Backtest on tick data at your account’s real spread and point value. Use an every-tick model with the standard 0.8–1.5 point spread you will actually trade, not the platform default. Include the overnight financing charge — on an index that holding cost is part of the strategy, not a footnote.
- Scale the stops, then read the worst losing streak. Confirm the stops and targets are sized to the Nas’s larger range rather than an S&P multiplier. Then read the max drawdown and the longest run of losing trades in account-currency terms, not points — the Nas’s absolute swings turn a modest point drawdown into a large capital one. Budget for the worst streak before you fund it.
- Forward-test on demo through one FOMC and one big-tech earnings print. The Nas’s defining risks — rate sensitivity and single-name concentration — only show up around those two catalysts. A demo window that never spans an FOMC decision or a mega-cap earnings report has not tested the things that matter most.
- Confirm the server clock before the first live trade. Re-check MT5’s Market Watch time against the UTC session hours above, and re-check it after any broker migration. Easy to skip, expensive to miss.
Every backtest number this produces is a historical measurement, not a forecast — size for the drawdown you measured, not the return you hope for.
NAS100 EAs and Builder Templates
No dedicated NAS100 EA is currently listed in our catalogue. Our full five-year backtests sit on FX majors, and we will not pass off a forex EA — or a strategy tested on a calmer index — as a tested Nas one. The honest route to a NAS100 EA is to build and verify one:
- The Builder (open it here) accepts NAS100 in its trend and breakout templates and exposes every parameter. The EA you deploy is built on your own numbers and your own sizing arithmetic.
- Broker and account fit. The Nas’s cost, point value and overnight financing depend on the account. Check those conditions on your own broker before you size anything — our broker catalogue compares index-CFD conditions.
- The concept canonicals. If a term above is unfamiliar, the volatility, ATR and leverage entries define the mechanics a Nas EA depends on most.
Frequently asked questions
- What is the best EA for NAS100?
- There is no NAS100-specific EA with a five-year backtest in our catalogue yet — our full backtests currently sit on FX majors, not stock-index CFDs. You can build a Nasdaq trend or breakout EA in the Builder instead, then judge it the way you would any strategy: read the worst losing streak and max drawdown before the headline profit factor, and validate on tick data at your own broker's spread and point value. On an index, add one check FX rarely needs — confirm the point value and the overnight financing your broker charges, because both change the arithmetic a forex-shaped EA assumes.
- Why does NAS100 move more than the S&P 500?
- The Nasdaq 100 is a concentrated basket of long-duration, high-growth technology names, so the same macro move — a rate surprise, a risk-on rotation — reprices it harder than the broader, more diversified S&P. That is why it is described as the highest-beta of the US indices: a stop sized for the S&P's calmer range often gets run over on the Nas. The extra range is opportunity for a trend or breakout EA and a hazard for anything that assumes an S&P-shaped move.
- Can you scalp NAS100 with an EA?
- It tends to be the wrong instrument for it. The Nas moves in fast, whippy swings that punish the tight stops a scalper relies on, and its wide intraday excursions turn small targets into coin-flips. Most index strategies work better as trend or breakout systems on M15 or H1, where the larger moves make the spread and the noise a small fraction of the trade rather than the whole margin.
- Does NAS100 gap overnight?
- Yes — and it is one of the failure modes a forex EA never has to model. Big-tech companies report earnings after the US cash close, so the index can gap sharply at the next session's reopen before a stop can act on the move. A long position held overnight also pays a financing charge at the daily rollover, which quietly erodes any slow trend edge over time.
- Is holding NAS100 and US500 diversification?
- No. The Nasdaq 100 and the S&P 500 share most of their mega-cap technology weight and move together on the same macro drivers, so running an EA on each is closer to one leveraged risk-on bet than a hedge. The correlation doubles your exposure without appearing anywhere in either EA's risk settings — treat a multi-index book as a single position when you size it.
Related symbols
Related articles
Glossary